Graphics
Recognition for a Large-Scale Airplane Information System
The Boeing Company, 7L-44, PO Box 24346, Seattle, WA 98124
Boeing's Intelligent Graphics team also includes Mike Carter, Susan
Chew, Chuck Gebhardt, Brent Hadley,
Ed Hall, Tom Jenkins, Cathy Kitto, Steve Pruitt, and Dave Shema
Abstract
The Boeing Company maintains tens of millions of pages of information
associated with the manufacture and delivery of its products. Much of this
information must be made available electronically. We have developed tools
to automatically convert and integrate electronic data into industry standard
formats. Some of the technical challenges include 1) handling a wide variety
of source formats, 2) making sure that the tools scale up to handle millions
of pages of information, and 3) adding functionality to graphics. Our system
contains over four million pages of text including tens of thousands of
graphics.
In this paper we describe tools that recognize and use information within
airplane-related vector and raster images. Such images include troubleshooting
charts, fault reporting diagrams, component location diagrams, component
index tables, wiring diagrams, system schematics, parts illustrations,
standards tables, and structural and tooling drawings. Each airplane requires
conversion of over 20,000 graphics including over 900,000 pieces of cross-referenced
information. We are also exploring visual information retrieval strategies,
including content-based and similarity-based methods for both vector and
raster graphics.
Keywords: information retrieval, hypermedia
Four Million Pages and Growing
The Boeing Company is committed to Air Transport Association Specification
2100 [1] which requires the use of the Standard Generalized Markup Language
(SGML) [2]. To comply with these specifications Boeing has converted millions
of document pages to SGML. Document sources include commercial tools (e.g.,
Microsoft Word, InterLeaf, FrameMaker), internal proprietary tools, and
data from external vendors.
Our team built a series of text autotaggers that automatically
convert documents into SGML. From 1990 to the present we developed autotaggers
to create a testbed hypermedia system containing data from over four million
pages. We will report our text autotagging methods and results elsewhere.
Graphic Navigation and Functionality
The autotaggers receive text in various formats. They receive graphics
in vector formats (usually CGM) and raster formats (usually TIFF) and originally
did little more than pass the graphics to viewers in DynaText. The graphics
lacked information for navigation and retrieval. Users often needed to
examine many images to find the right one, including multiple panning and
zooming operations. Hyperlinking from a text reference in a graphic was
not possible, nor was full text search. The graphics also lacked useful
functional information -- What is the logic in this troubleshooting diagram?
What are the relationships between items in this table? What lines in this
wiring diagram represent continuous circuits?
We built a series of graphic recognition tools that use vector and raster
graphics to produce navigational and functional information represented
in SGML. We then integrated this information into the testbed.
Graphics Recognition Tools
We used a similar approach for each graphic recognition problem:
* Develop a tool to reason about vector or raster graphics.
* Tune and evaluate the tool for accuracy and the ability to scale up.
* Integrate acquired graphic information with text in the testbed.
* Evaluate the usability of the results.
* Transfer the results to products and services.
The image counts given below are for a recent Boeing 747 airplane maintenance
manual set. They illustrate the large scale of the problems.
|
|
|
|
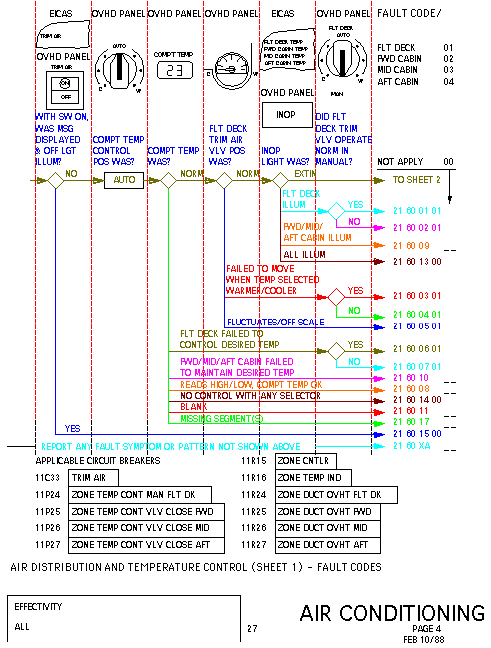
Figure 1. The fault diagram recognizer finds
arrows, diamonds, and other information, then uses knowledge about diagram
layout to produce the application's flow of logic.
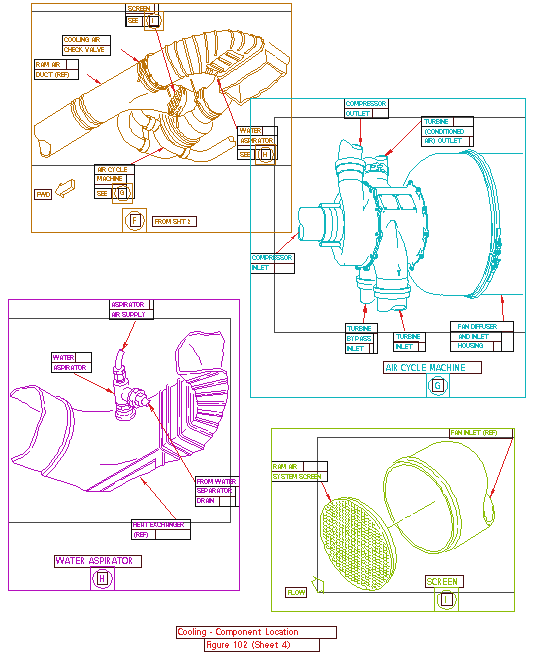
|
Figure 2. The component location recognizer
uses page layout logic to induce groups and attach callouts.
|
Fault reporting diagrams are vector images that pilots use to
determine what messages to record in the flight logbook when a malfunction
occurs. We've been able to accurately determine the decision networks in
these diagrams and generate over 20,000 hot spots in over 1,600 diagrams
(Figure 1). To illustrate our methodology, we will discuss the processing
of these drawings:
Rather than a general-purpose recognition system, our methodology entails
constructing an individual recognizer for each class of drawing we analyze,
using heuristic knowledge of how that particular class is constructed.
Thus the recognizer for fault reporting diagrams is a different application
than that for component location diagrams (Figure 2.) To illustrate our
approach, we will outline the basic steps in the recognition of fault reporting
diagrams.
Each diagram consists of header art, below which is a series of questions.
Beneath each question are the various responses for that question. These
answers are connected through a series of horizontal arrows and decision
diamonds to comprise a decision tree. A path through the diagram will ultimately
lead to a fault code which should be entered in the flight logbook.
The recognizer performs these steps in building a complete and accurate
internal representation of the decision tree:
1) Recognize column separation. Find the vertical dashed lines
that partition the drawing. Not all vertical dashed lines are column separators,
so we apply heuristics to filter those out.
2) Recognize decision diamonds and all arrows and their horizontal
and vertical shafts. There are no "arrowhead" elements; rather
arrowheads are built out of individual line segments that are close enough
together, so that when the drawing is printed, the ink will produce a solid
arrowhead. In fact, the drawings we analyze have no graphical elements
in them other than line segments and text fragments. The recognizer knows
the patterns of line segments for arrows and decision diamonds. Significant
error handling is needed to detect arrows that deviate from the general
case and to filter out objects that erroneously appear to be arrows. The
recognizer must then determine from which column an arrow emanates. Thus
it follows the individual line segments back from the arrowheads until
encountering a vertical shaft line.
3) Classify text. We analyze individual text fragments to determine
if they are pieces of questions, pieces of responses to questions, fault
codes, or extraneous to the decision tree. We concatenate question fragments
into complete questions and response fragments into coherent responses.
This heuristic analysis is non-trivial, since answer fragments can be arbitrarily
close to questions and similarly aligned,.
4) Attach response text to arrows. Typically the response that
is associated with an arrow lies directly above it, but this is not always
the case. Occasionally a response will vertically straddle an arrow (one
fragment of the response will be above the arrow, another will be below.)
The recognizer must reason about the distributions of interline spacing
throughout the diagram to make the correct decisions.
5) Build the internal decision tree. Starting with the left-most
decision diamond, the recognizer follows the arrows to build an acyclic
directed graph corresponding to the arrows and diamonds on the drawing.
There should be a one-to-one correspondence between terminal nodes in the
graph and the fault codes. Because there are occasionally missing arrows
due to authoring errors, the recognizer must induce them to build a complete
tree. This is typical of the extensive error-correction the recognizer
must perform in order to achieve scalability to the large datasets we process.
Using this recognizer, we are able to convert a complete set of drawings
for a Fault Reporting Manual into different styles of interactive electronic
books. For example, using one style, the system presents the user with
each question on a separate screen and, depending on the response, will
present the next set of question and responses in the decision tree. Another
presents the original graphic with hot spots that are automatically generated.
The user can click on the appropriate response and the system will automatically
zoom in on the next question/response area.
By devising additional heuristics and recognition algorithms, we have
adapted this methodology for many other drawing classes.
Troubleshooting charts are vector drawings that provide mechanics
with decision trees for fault isolation. One drawing can consist of as
many as 30 individual sheets with intersheet connections linked by references.
Our software analyzes the layout of the boxes and the arrows connecting
them and builds an internal representation of the decision tree. It then
generates hot spots so that users can easily navigate within a sheet and
among sheets as well as follow links to other information. This manual
set contains over 750 charts containing over 16,000 hot spots.
Component location diagrams provide exploded views of aircraft
and their components. Typically one diagram consists of multiple sheets,
each of which has one or more subpictures (insets) with internal callout
references. Our software must reliably subdivide each image into subpictures
and generate the hot spots that link the callouts to the correct subpicture,
including references to other sheets. In addition, the software generates
hot spots around each equipment number, so that mechanics can easily navigate
from the picture to information about that piece of equipment. This manual
set contains over 650 vector component location diagrams; the system produced
over 3200 subpictures containing over 25,000 hot spots (Figure 2).
Component index tables are vector drawings that tell the mechanic
where to go to find the maintenance procedures for the equipment illustrated
in the component location drawings. The index table recognizer determines
the individual table cells and relationships among cell contents. It generates
over 14,000 hot spots in over 300 tables linking the drawings to component
location diagrams, other component index tables and to maintenance procedures.
Wiring diagrams are vector drawings extracted from computer-aided
design data sets. The intelligent graphics software analyzes both the vector
image and the data set to determine how wires are laid out in the drawings
so that circuit tracing is enabled in the hypermedia viewer. In addition,
there are hot spots providing hyperlinks to equipment lists and wire lists
as well as other diagrams. This manual set contains over 1400 diagrams
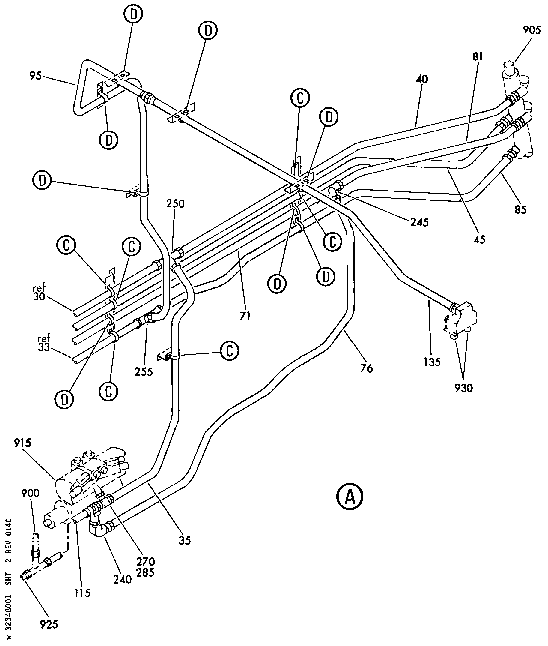
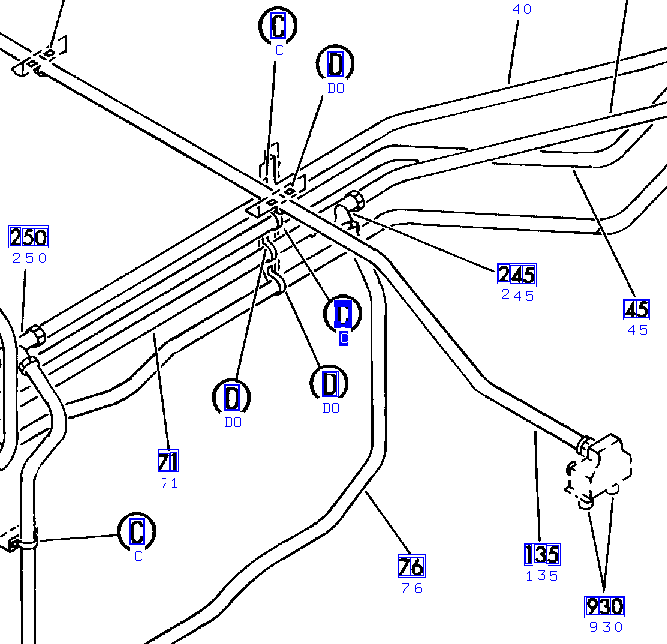
with over 135,000 hot spots (Figures 3, 4).
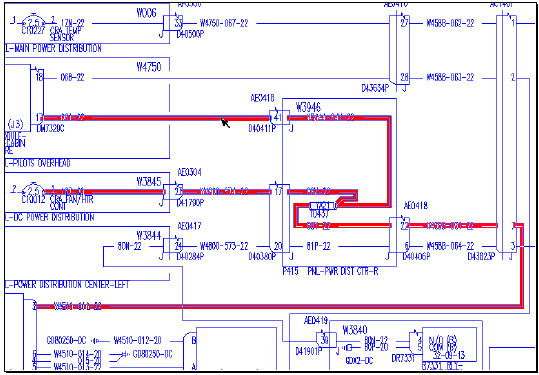
Figure 3. A wiring diagram recognizer finds
connected circuits and links references
together.
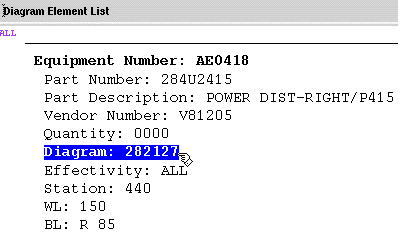
Figure 4. Users follow hotlinks to retrieve equipment
information. The system stores
wiring diagram links and other references in the DynaText database.
System Schematics are similar in functionality and recognition
requirements to wiring diagrams. This manual set contains over 1300 system
schematics with over 461,000 hot spots.
Parts illustrations are raster images that provide exploded
views of the airplane much like component location diagrams. They contain
callouts and item numbers that must be linked to other pages. Because they
are raster images we must perform more complex analysis than with the vector
images. We have developed routines to quickly process callouts and item
numbers with high accuracy. This manual set contains over 13,000 sheets
with more than 241,000 hot spots (Figure 5).
|
|
|
Figure 5. A raster parts illustration
recognizer finds callouts and reference numbers,
using symbol finding and optical character recognition |
Standards tables contain information about Boeing engineering
practices. The sources for many of these tables are paper copies that were
several generations old, made with typewriters and ruled with ball point
pens. The conversion team scanned these images for on-line use and was
planning to manually re-enter the information. We developed recognition
software to extract the logic in the tables. Together with a commercial
optical character recognition package we automatically converted over 6600
tables to InterLeaf format (Figures 6, 7). Later these will also be converted
to SGML.
Evaluating Recognition Results
To evaluate the results of text tagging our team commercial SGML verifiers
and specialized custom systems. We developed tools that analyze the text
output for consistency and completeness, including statistical measures
and link verification. Often these tools find authoring errors as well
as tagging errors.
It is more difficult to build such tools to check graphic recognition
accuracy. We built a custom graphic analysis tool that simultaneously shows
recognized objects and the corresponding SGML (Figure 8). For example,
if the recognizer finds a reference, the viewer displays the hot spot along
with the information as to what type of reference it is and to what it
refers. Using this viewer we manually sampled thousands of images to assess
recognition accuracy. Recognition accuracy ranged from about 97% for component
location graphics to 99.9% for troubleshooting charts. These results exceeded
our performance goals.
We can also find some types of graphics authoring errors. For example
we can automatically detect incorrect references that point to non-existent
locations. Previously, such errors could only be found by manual inspection.
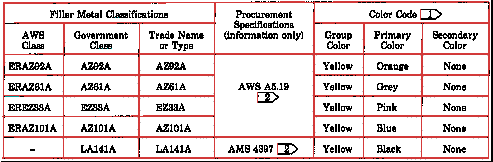
Figure 6. This original standards table was made
using a typewriter and ball-point pen.
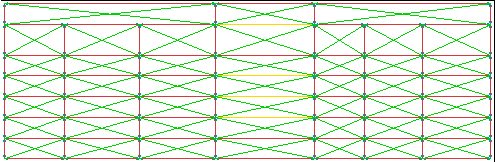
Figure 7. After scanning the table in Figure 6, the
table recognizer automatically finds cells, performs character recognition,
then produces standard mark-up files.
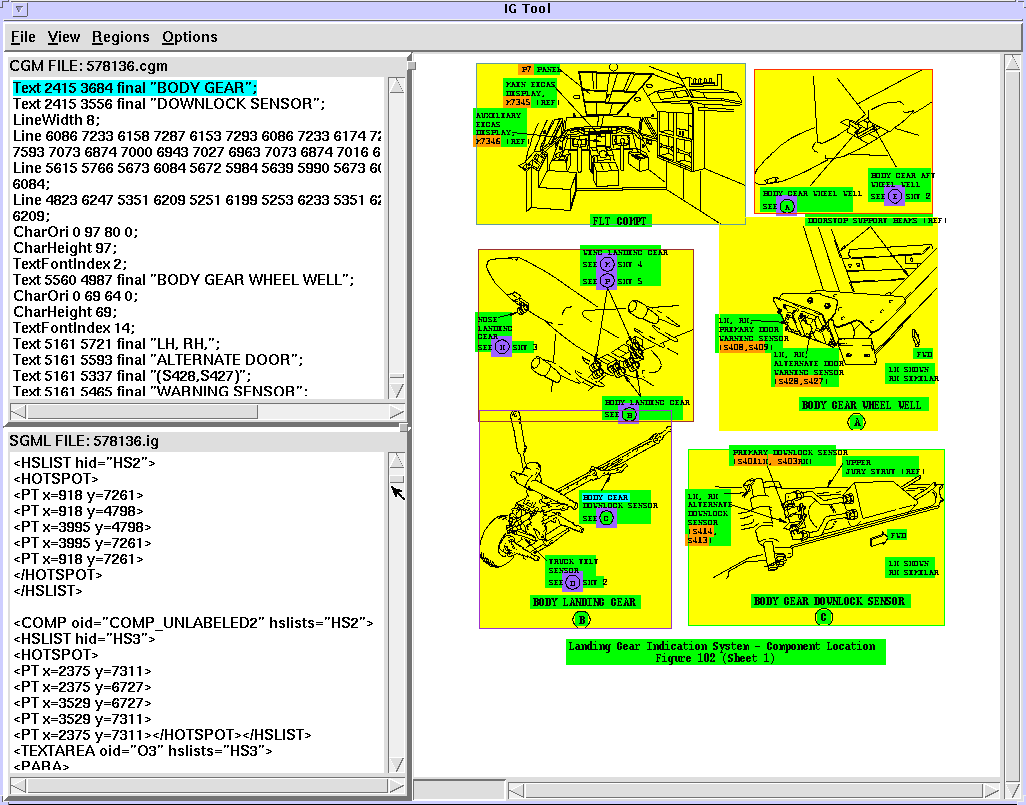
Figure 8. We assess recognition accuracy using our
custom graphics analysis tool.
Future Challenges - Work in Progress
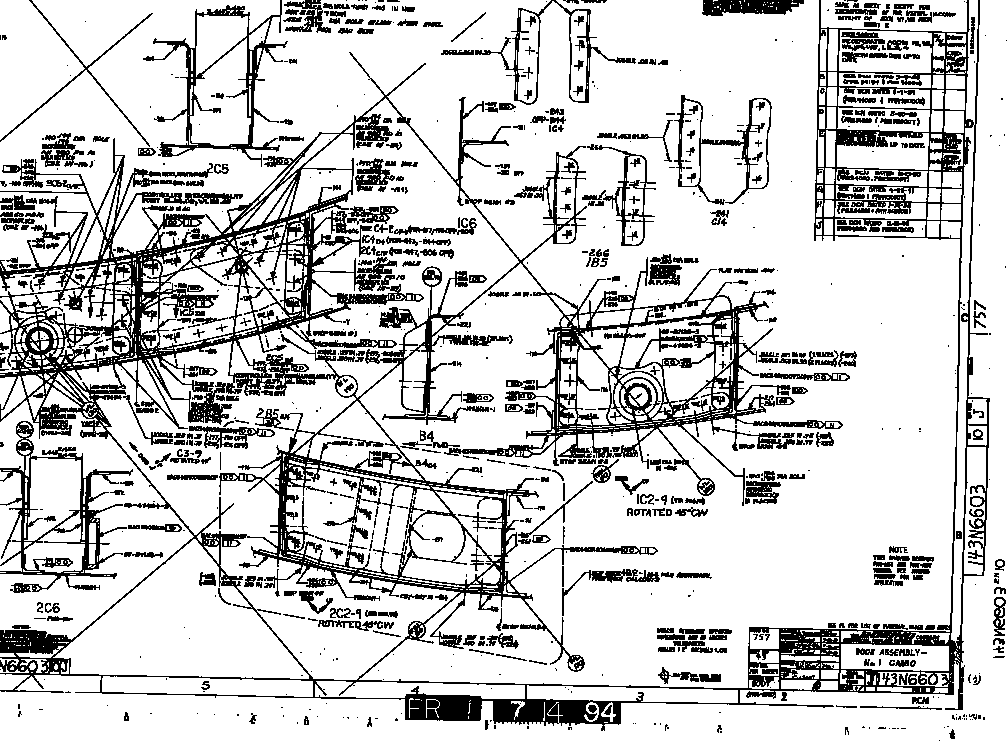
We are currently working with Boeing's library of millions of structural
and tooling raster drawings. These drawings have been scanned from aperture
cards and placed on-line. We would like to recognize objects such as title
blocks, part numbers, dimension lines, materials lists, and parts tables.
Much of the text is hand written and many of the scanned images are skewed
or noisy. This is challenging work (Figure 9).
|
|
|
|
Figure 9. The structural and tooling drawing
recognizer must find part numbers, title blocks, and dimensions lines in
raster images.
|
We are also working on visual information retrieval strategies, including
content-based and similarity-based methods (Figure 10).
Summary
We have successfully added functionality to tens of thousands of vector
and raster graphics, integrating them with text in on-line navigation systems,
addressing the problems of scale and accuracy. We hope to continue to add
functionality to graphics to enhance the overall utility of Boeing's digital
data.
References
[1] ATA (1995). Air Transport Association Specification 2100 - Digital
Data Standards for Aircraft Support, 1995, Order code A090
[2] Goldfarb, Charles F. (1990). The SGML Handbook, Oxford University
Press, ISBN 0-19-853737-9
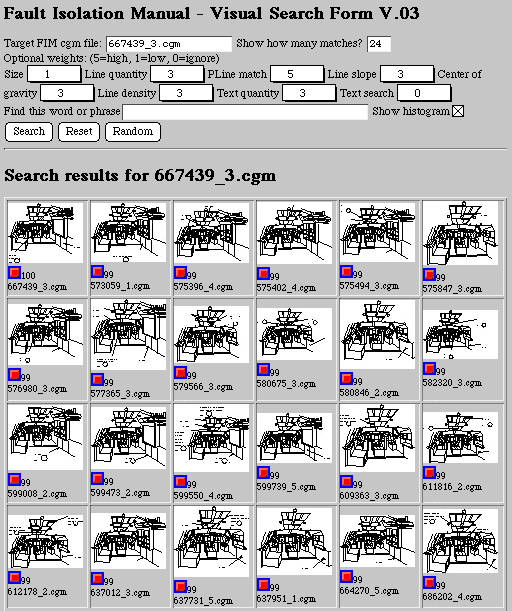
Figure 10. Our prototype visual search engine
finds similar vector images in a database of over 6,000 drawings.
GREC'97 program