An Experimental Survey on Big Data Frameworks
Wissem Inoubli, Sabeur Aridhi, Haithem Mezni, Mondher Maddouri and Engelbert Mephu Nguifo
Summary
In this experimental study we try to compare the most popular Big Data frameworks. We divided the experiment study into two parts: (1) batch mode processing and (2) stream mode processing. The experimental study covers the performance, scalability, impact of several configuration parameters on the performance and resource usage study of frameworks such as SPARK, HADOOP, FLINK, SAMZA and STORM. We have chosen WordCount, Kmeans and PageRank workloads with real and synthetic data sets to evaluate the frameworks in batch mode and an Extract, Transform, Load (ETL) process to evaluate the studied frameworks in stream mode.
All the experiments were performed in a real cluster called GALACTICA (https://galactica.isima.fr) and hosted in the LIMOS laboratory at the Clermont Auvergne University. The cluster is composed of 10 machines operating with Linux Ubuntu 16.04. Each machine is equipped with a 4 CPU, 8GB of main memory and 500 GB of local storage. For our tests, we used HADOOP 2.6.3, FLINK 1.1.0, SPARK 1.6.0, SAMZA 0.10 and STORM 0.9. Both Spark and Flink have been deployed in the stand-alone mode, while Hadoop and Storm have been deployed respectively with zookeeper and YARN cluster manager. For all the evaluated frameworks, we used the default values of their corresponding parameters. We also varied these parameters in order to analyze the impact of some parameters on the performance.


Experimental protocol
We consider two scenarios according to the data processing mode. For each scenario, we measure the performance of the presented frameworks.
- Batch Mode: In the Batch Mode scenario, we evaluate HADOOP, SPARK and FLINK while running our workloads, in the WordCount application we have used a set of tweets as a data set. The used tweets were collected by Apache Flume and stored in HDFS. The motivations behind using Apache Flume to collect the processed tweets is its integration facility in the HADOOP ecosystem (especially the HDFS system). Moreover, Apache Flume allows collecting data in a distributed way and offers high data availability and fault tolerance. We collected 10 billions tweets and we used them to form large tweet files with a size on disk varying from 250 MB to 100 GB of data. For KMeans application we generated a synthetic datasets containing between 1000 and 50 millions learning examples. For PageRank workload we have used four real graph datasets with different number of nodes and edges. Table 1 shows more details of the used datasets. The above presented datasets have been downloaded from the Stanford Large Network Dataset Collection (SNAP)and formatted as plan files in which each line represents a link between two nodes.
| Dataset | Number of nodes | Number of edges |
|---|---|---|
| G1 | 685 230 | 7 600 595 |
| G2 | 875 713 | 5 105 039 |
| G3 | 325 729 | 1 497 134 |
| G4 | 281 903 | 2 312 497 |
| G5 | 1 965 206 | 2 766 607 |
| G6 | 3 997 962 | 34 681 189 |
| G7 | 4 847 571 | 68 993 773 |

Fig 1. Batch Mode scenario
- Stream Mode: In the Stream Mode scenario, we evaluate real-time data processing capabilities of STORM, FLINK and SPARK. The Stream Mode scenario is divided into three main steps. The first step is devoted to data storage. Do to this step, we collected 1 billion tweets from Twitter using Apache Flume and stored in HDFS. Those data are then sent to KAFKA, a messaging server that guarantees fault tolerance during the streaming and message persistence .

Fig 2. Stream Mode scenario
To allow monitoring resources usage according to the executed jobs, we have implemented a personalized monitoring tool as shown in the Figure below.

Fig 3. Architecture of our personalized monitoring tool
SnapShots
Here, we present snapshots of the codes used to implement the WordCount workload with the studied frameworks

Fig 4. Snapshot of the code used to implement the WordCount with Hadoop

Fig 5. Snapshot of the code used to implement the WordCount with Spark

Fig 6. Snapshot of the code used to implement the WordCount with Flink

Fig 7. Snapshot of the code used to implement the WordCount with Storm

Fig 8. Snapshot of the code used to implement the WordCount with Samza
Results
Batch Mode: Scalability
This experiment aims to evaluate the impact of the size of data on the processing time. In this experiment, we used two simulations according to the size of data: (1) simulation with small datasets and (2) simulation with big datasets. Experiments are conducted with various datasets with a size on disk varying from 250 MB to 2 GB for the first simulation and from 1 GB to 100 GB for the second simulation.

Fig 9. Impact of the size of the data on the average processing time: case of small datasets

Fig 10. Impact of the size of the data on the average processing time: case of big datasets

Fig 11. Impact of the number of machines on the average processing time.
Batch Mode: Iterative processing
In this experiment, we tried to evaluate our frameworks in the case of iterative processing with both workloads Kmeans and PageRank.

Fig 12. Impact of iterative processing on the average processing time

Fig 13. Impact of the number of iterations on the average processing time (Kmeans workload with 10 million examples and 10 iterations)
In the same context of the iterative processing, through both use cases Kmeans and Pagerank we evaluated the impact of number of iteration on the response time

Fig 14. Impact of HDFS block size on runtime (Kmeans workload with 10 million examples and 10 iterations)
In this experiment, we try to show the impact of data partitioning on the studied frameworks. In our experimental setup, we used HDFS for storage. We varied the block size in our HDFS system and we run Kmeans with 10 iterations with all the used frameworks.
Batch Mode: Impact of some configuration parameters
In order to understand the impact of the configuration parameters on the performance and the quality of the results, we try in these experiments to study some configuration parameters mainly related to the RAM and the number of threads in each framework.
Apache Flink : In order to evaluate the impact of some configuration parameters on the performance of Flink, we first executed our workloads while varying the number of slots in each TaskManager. Then, we varied the amount of used memory by each TaskManager.
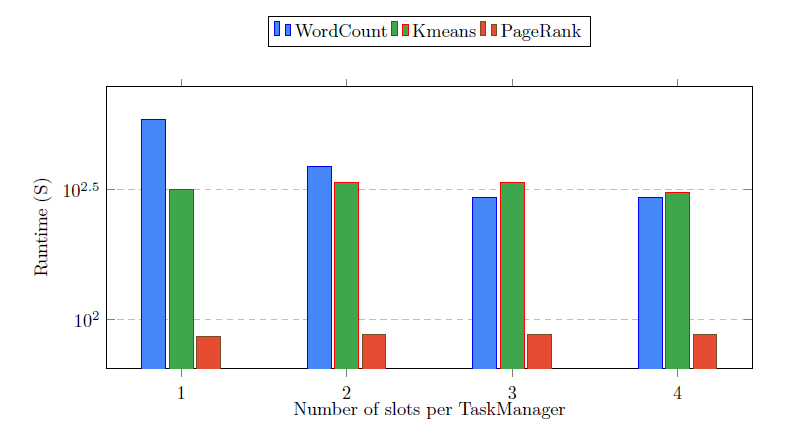
Fig 15. Impact of parallelism parameters on the performance of Flink
Fig 16. Impact of RAM parameters on the performance of Flink
Apache Spark : The parallelism configuration in Spark requires the definition of the number of workers by machine. In addition, the memory management is primordial as we must configure the memory for each worker. These two parameters are respectively spark.worker.instances and spark.worker.memory.

Fig 17. Impact of number of worker on the performance of Spark

Fig 18. Impact of RAM parameters on the performance of Spark
Apache Hadoop : To configure the number of slots on each node in a Hadoop cluster, we must set the two following parameters: (1) mapreduce.tasktracker.map.tasks.maximum and (2) mapreduce.tasktracker.reduce.tasks.maximum. These two parameters define the number of map and reduce functions that run simultaneously on each node of the cluster. These parameters maximize the CPU usage which can improve the processing time.

Fig 19. Impact of the number of slots on the performance of Hadoop

Fig 20. Impact of RAM parameters on the performance of Hadoop
Batch Mode: Resource usage (WordCount workload with 50 GB of data)
Here, we measure the CPU, RAM, disk I/O usage as well as and bandwidth consumption of the studied frameworks in a Batch Mode scenario.

Fig 21. CPU resource usage by FLINK, HADOOP and SPARK.

Fig 22. RAM resource usage by FLINK, HADOOP and SPARK.

Fig 23. Disk resource usage by FLINK, HADOOP and SPARK.

Fig 24. BW resource usage by FLINK, HADOOP and SPARK.
Stream Mode: Events processing
The goal here is to compare the performance of the studied frameworks according to the number of processed messages within a period of time. In the first experiment, we send a tweet of 100 KB (in average) per message and in the seconds experiment we duplicated this message fives time (500 kb in average).

Fig 25. Impact of the window time on the number of processed events (100 KB per message).

Fig 26. Impact of the window time on the number of processed events (500 KB per message).
Stream Mode: Resource usage (with 100 KB per message use case)
Here, we measure the CPU, RAM, disk I/O usage as well as and bandwidth consumption of the studied frameworks in a Stream Mode scenario.

Fig 27. CPU resource usage by FLINK, HADOOP and SPARK.

Fig 28. RAM resource usage by FLINK, HADOOP and SPARK.

Fig 29. Disk resource usage by FLINK, STORM and SPARK.

Fig 30. BW resource usage by FLINK, STORM and SPARK.
Downloads
Batch Mode scenario
Flink projects (Jar files and source code):
WordCount |
Iterative
workload Hadoop projects (Jar files and source code): WordCount | PageRank | Kmeans
Spark projects (Jar files and source code): WordCount | Iterative workload
Stream Mode scenario
Flink project (Jar file and source-code) is downloadable
here
Storm project (Jar file and source-code) is downloadable here
Spark project (Jar file and source code) is downloadable here
Samza project (Jar file and source-code) is downloadable here
Monitoring tool
Our python script (deployed in
every machine of our cluster to collect
CPU, RAM, Disk I/O, and Bandwidth history) is available in this github
repository.
For more details about running our scripts, please follow the steps in this readme file file.